

With tens of thousands of stocks to choose from in the US market alone, it can be hard to know what companies to invest in. So, having a pipeline to identify potential investment opportunities and pick individual stocks to buy is key to seeing a return from trading.
Researching stocks is a labor-intensive process that takes patience, dedication, and attention to detail. However, it doesn’t have to be hard. In this guide, we’ll break down how to research stocks into five simple steps and highlight some free tools that can help you get started.

Step 1: Define What You’re Looking For
The first step in narrowing the number of stocks you need to pay attention to is to define what you’re looking for.
Does your trading strategy revolve around finding undervalued companies and holding them until the market realizes what they’re worth? Or are you investing with a momentum strategy in mind, buying hot stocks and selling them before they lose steam?
You could also build a strategy around stocks in a certain market sector, or around stocks that have exposure to an emerging technology like self-driving vehicles.
Defining the type of stocks you’re looking for is essential to knowing when you’ve spotted a trading opportunity.
Step 2: Quantify Your Criteria
Once you have a type of stock in mind, it’s time to attach some numbers to define that type. For example, if you’re looking for undervalued stocks, how will you know if a company is undervalued? You might quantify a stock as ‘undervalued’ if it’s trading for less than a specific P/E value, or if it has less than a certain debt to free cash flow ratio.
If you’re interested in momentum stocks, think about how to quantify momentum. You might look at technical indicators, such as a rising MACD or a bullish moving average crossover. You could also use trading volume as a criterion for defining momentum.
Whatever your strategy, attaching quantitative metrics gives you a framework for deciding what stocks fall under the umbrella of your strategy and what stocks do not.
Keep in mind that not every aspect of your strategy needs to be quantifiable – you just need some rough guidelines to help you broadly identify stocks that might be of interest. You can narrow down your research later in the process.
Step 3: Build a Broad List of Candidates
Using the quantitative metrics you developed for your trading strategy, you can now build an initial list of stocks that could warrant more attention.
There are a couple ways to go about this, but the best place to start is with a stock screener. You can use a combination of technical and fundamental parameters to generate lists of stocks that meet your trading criteria. Be lenient when setting your scanner filters, as it’s better to include more stocks at this stage than fewer.
You can also identify potential stocks to trade by taking a broad look at the market. For example, see if there are there any stocks in lists of the day’s biggest gainers and losers that might fit into your strategy.
You can also turn to market news stories and ‘best stocks to buy today’ articles to learn about stocks that might not show up in your screener. You don’t want to pull in stocks that don’t fit your strategy, but this is a good way to identify companies that may meet your strategy’s goals without meeting the quantitative limits you decided on.

Step 4: Research Individual Stocks
At this point, you should have a list of several dozen stocks to follow up on. From that list, pick out a handful – around 10 or 20 – of the most promising candidates to research in more detail.
Depending on your trading strategy, your research at this point might focus more heavily on fundamental data or technical analysis. If you’re searching for stocks based on value, look under the hood at a company’s balance sheet, earnings forecasts, main revenue sources, and anything else that could impact earnings in the years ahead. It’s also a good idea to learn more about the management team and what executives have planned for the company.
If you’re searching for stocks based on momentum or other technical attributes, dive into price charts to look at what different indicators are signaling about the stock’s future direction. Check whether there are upcoming earnings reports, how the stock has behaved in the past, and whether there has been news or other catalysts behind recent price action.
Step 5: Plan Out Your Investments
Based on your in-depth research, it’s time to decide which stocks you want to invest in. Don’t feel pressured to invest in all of the stocks you spent time researching – that research can come in handy later if a stock doesn’t present a strong opportunity right now.
For each stock you want to invest in, create a detailed plan. This should cover not just how much you want to invest in each stock, but also elements like entry points, stop loss levels, and primary and secondary price targets. You can then use limit orders to place your trades right away, or set up alerts so that you’re notified when a stock reaches your desired entry price.
Helpful Tools for Stock Research
There are hundreds of tools for stock research, and it’s well worth exploring some of them to find platforms that can make your research more efficient and more comprehensive. To help you get started, here are three free tools that can help you build a list of stock candidates and research individual stocks.
FinViz – Fundamental and Technical Stock Scanner
FinViz offers a free stock scanner that includes a wide range of both fundamental and technical parameters. The scanner covers all US stocks, and it’s easy to narrow down your search to just specific exchanges or market sectors.
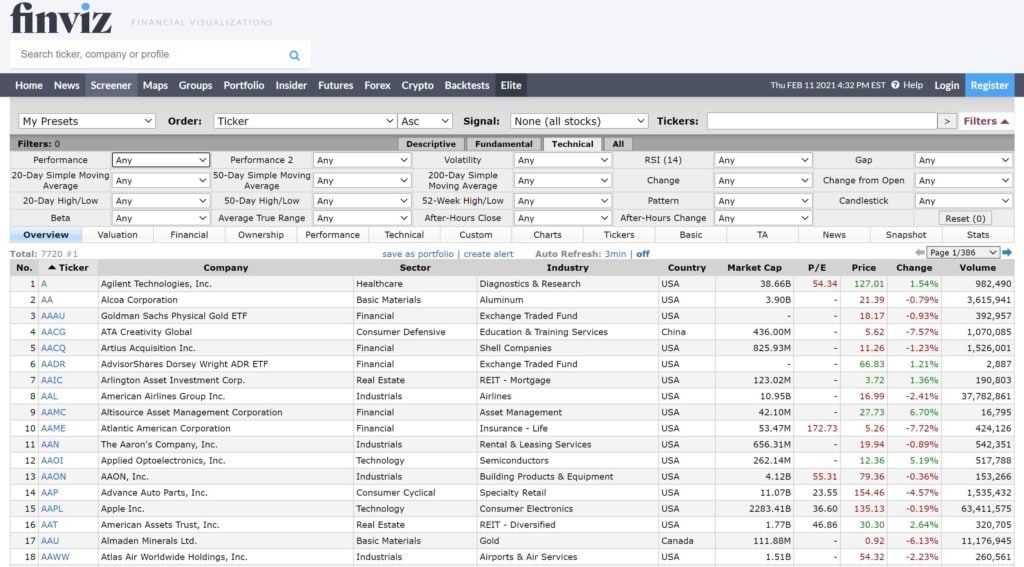
FinViz’s scanner is particularly helpful for identifying momentum stocks. You can filter stocks based on metrics like weekly or monthly volatility, 50- and 200-day moving averages, and daily, weekly, or monthly performance. So, for example, you could make a list of NASDAQ stocks that have gained more than 20% over the past month and have a price 10% or more above their 50-day moving average.
Yahoo! Finance – Fundamental Research
Yahoo! Finance is a one-stop-shop for financial data. You can access company’s balance sheets, plus view analysts’ price targets, changes in EPS over time, dividend information, and even major investors. This data is especially useful if you want to export data to Excel to build your own model of what a company is worth.

The platform also does a nice job of bringing in relevant technical information, such as 10-day and 3-month average trading volume, volatility, and short ratios. Most data on Yahoo! Finance is free, although estimates of fair value and research reports require a paid subscription.
TradingView – Advanced Technical Charting
TradingView is a powerful technical charting platform that includes more than 100 built-in studies. Even better, you can build your own indicators in TradingView using the platform’s script editor or borrow custom indicators built by other investors. The charting interface is extremely customizable and there are plenty of drawing tools to annotate price data.

TradingView is particularly helpful if you want to investigate stocks that fit a certain technical strategy further. For example, you could use the platform’s charts to look at MACD, moving averages, and RSI for stocks that turned up in a momentum screen from FinViz. TradingView also offers its own stock scanner, although it’s not quite as comprehensive as the one in FinViz.
Conclusion
Learning how to research stocks is a critical part of finding and acting on profitable trading opportunities. With this five-step process, you can easily build a list of stock candidates to monitor and focus your research efforts on just the most promising stocks.


